Will The Largest Crude Oil Production Cut in History Be Enough To Stabilize Prices?
What a difference a month makes
It was only March 8 when OPEC’s push for oil supply cuts failed and Saudi Arabia and Russia started a price war. The ensuing month saw global economic and social activity grind to a halt as the world sheltered in place to prevent the spread of COVID-19. New York Governor Andrew Cuomo ordered non-essential businesses to keep their workforce at home on March 20, while Texas Governor Greg Abbott enacted similar orders on March 31.
While Saudi Arabia and Russia are able to unilaterally influence supply, no country has the ability to influence global crude demand. The economic shutdown’s impact on demand caused the price war to spiral out of control.
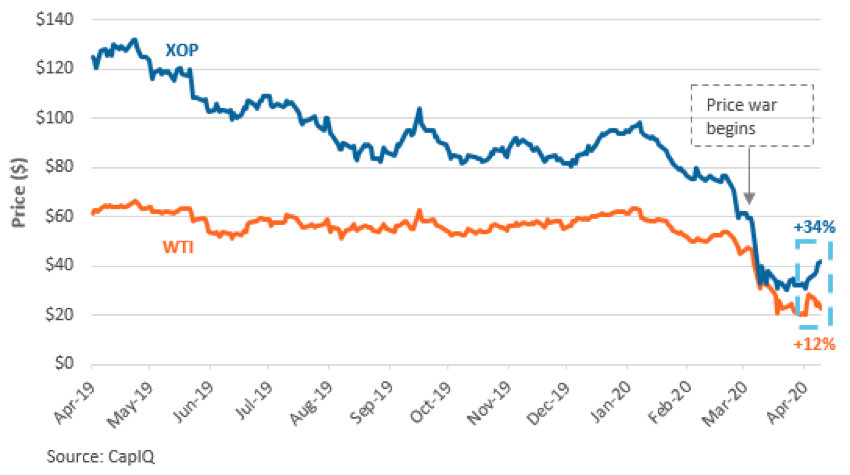
From the beginning of the price war on March 8 to the end on April 9, WTI fell from $41.28/ barrel (bbl) to $22.76/bbl, a nearly 45% drop with devastating effects on US oil and gas companies. During that same time, global liquids supply remained fairly consistent around 100 million bbls per day (mb/d), but demand dropped to less than 90 mb/d.
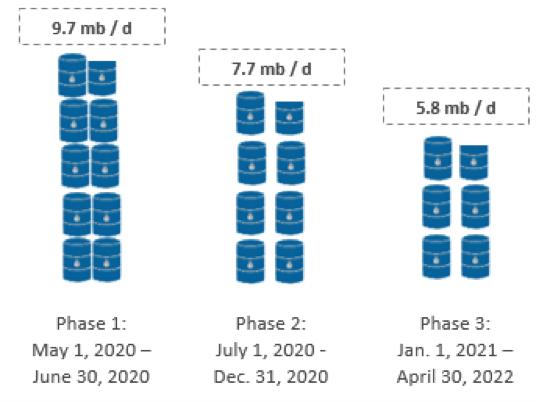
After only a month, Saudi Arabia and Russia were back at the negotiating table. On April 12, despite objections from Mexico, OPEC+2 announced production cuts of nearly 10 million bbls per day (mb/d). Specifically, the participating countries agreed to cut production in three stages: 9.7 mb/d for a two-month period starting May 1, followed by a six-month period of 7.7 mb/d and finally a 16-month period of 5.8 mb/d that will end April 2022.
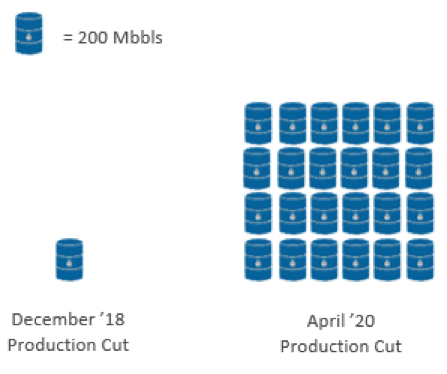
To put these production cuts in perspective, the group’s last production cut in December 2018 was 1.2 mb/d over a six-month period at a time when WTI was at $45.64. On a cumulative basis, the total December 2018 production cut was 200 mbbl compared to more than 4,800 mbbl in the April 2020 agreement.
Figure 2: Three Phases of April 2020 OPEC + Production Cuts
Figure 3: Comparing this OPEC + Production Cut to 2018
Supply and (Lack of) Demand
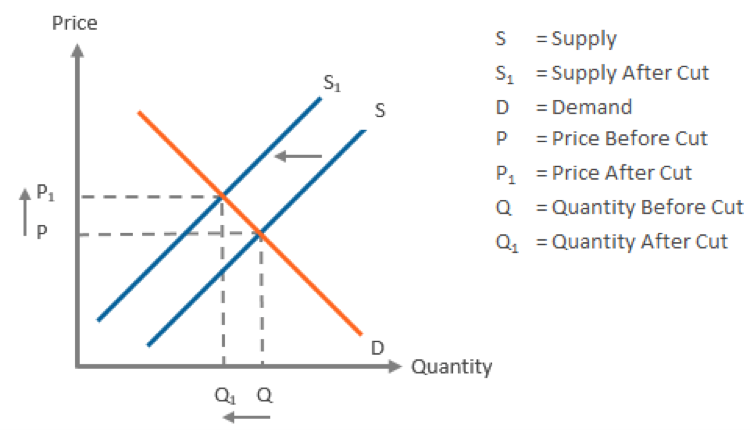
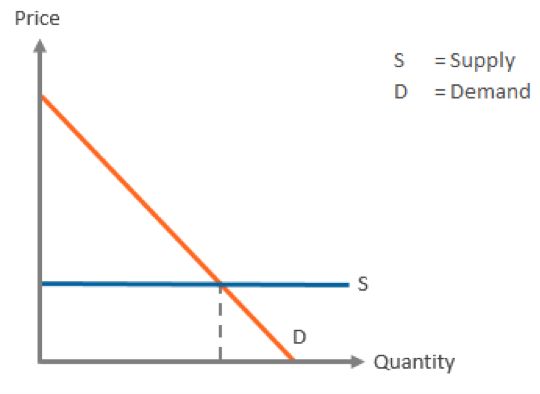
Reducing supply leads to an increase in price, all else kept equal (Figure 4). What the chart below doesn’t account for is the effect of COVID-19 on demand.
Figure 4: Supply & Demand Curve
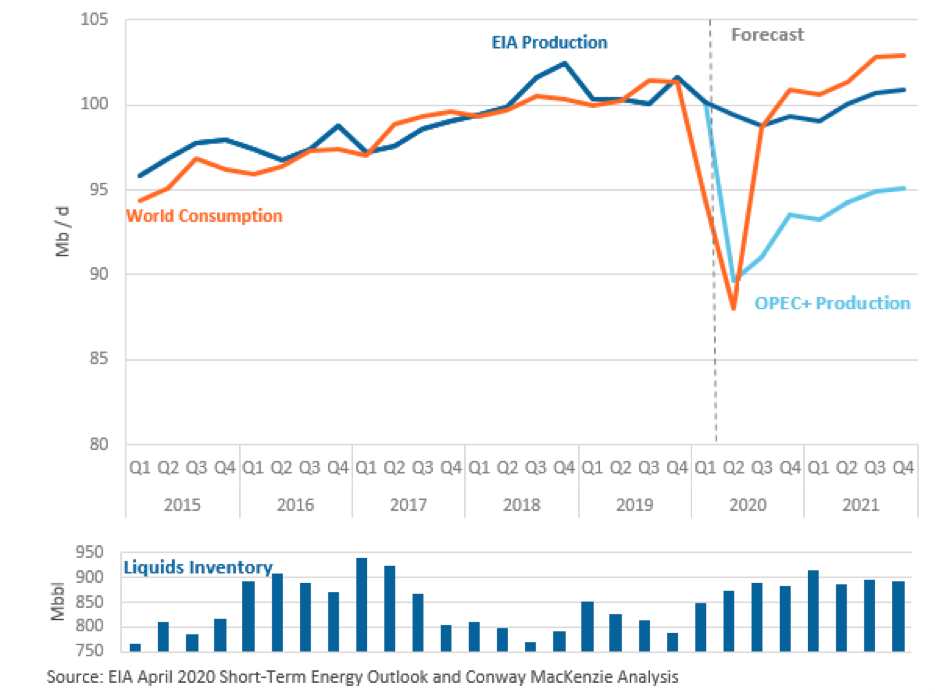
Pre-COVID-19, global liquids production was a little over 100 mb/d with demand roughly the same. With the recent OPEC+ cuts of 9.7 mb/d, estimated global liquids production will be around 90 mb/d in June and July.
The EIA expects a global oversupply of liquids of 8.6 mb/d for the first half of 2020, equating to 1,550 million bbls (mbbls) for the six-month period3. Reducing this oversupply by 9.7 mb/d for just two months may only decrease total oversupply by 580 mbbls to 970 mbbls.
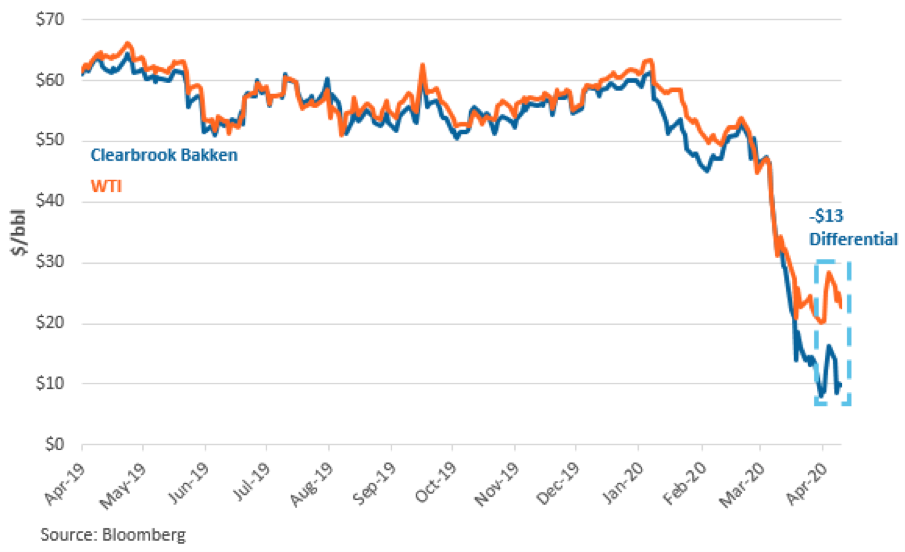
The EIA estimates that global storage capacity will be at capacity in the second quarter despite new (secondary) capacity coming online every day. The practical impact of capacity constraints means bottlenecks for liquids on their way to refineries. For instance, liquids storage capacity’s impact on oil prices is reflected by price differentials in the United States: the farther away production is from coastal refineries, the lower the realized price and the higher the differential. Clearbrook Bakken, the marker for North Dakota Bakken crude oil, is currently a $13.90/bbl discount to WTI for a realized price of $8.86 bbl.
Figure 5: Clearbrook Bakken and WTI Spot Price
The very large volume of stored liquids changes the slope (or elasticity) of the supply curve in our chart from upward sloping (the higher the demand, the higher the price) to flat. The theory is that stored liquids will enter (or more likely flood) the market at certain price points as storing companies monetize storage– storage is expensive, and it’s getting more expensive as secondary storage is (re)opened. Until liquids storage is reduced to normalized levels (8-10 days of demand), macro-economic factors will not support significant oil price increases.
Figure 6: Perfectly Elastic Supply
Assuming the OPEC+ production curtailments through April 2022 are adhered to, the EIA estimates global production will be at 92 mb/d for the second half of the year with demand returning to around 100 mb/d (and a never-before-seen 102 mb/d in 2021). This would imply that the increased levels of stored liquids will be eliminated by the end of 2020, signaling a light at the end of the tunnel for crude bulls. On the other hand, if a COVID-19-induced recession dampens demand or less disciplined oil-producing countries defy their production quotas, the period of oversupply could persist well into 2021.
Figure 7: EIA April 2020 Short-Term Energy Outlook with OPEC+ Production Cuts
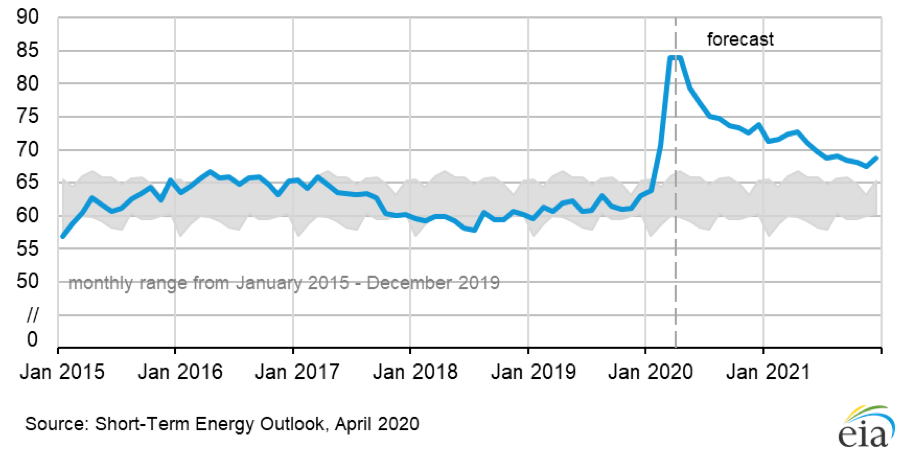
The EIA’s current Organization for Economic Cooperation and Development (OECD) forecast for commercial inventories of crude oil and liquids will reach almost 85 days of supply. In other words, if production we be reduced to zero, there would still be enough supply to meet the world’s demand for nearly three months.
Figure 8: OECD Commercial Inventories of Crude Oil and Liquids Storage
The Road to Recovery
If OPEC+’s latest production cuts won’t actually provide necessary near-term relief, then why has XOP’s stock price increased 34% in the last week?
It might be (unfounded) optimism or a reflection that at least one uncertainty is mitigated: continued oversupply and continuously increasing liquids storage. While US oil and gas producers have a long road to recovery ahead, the OPEC+ production cuts and the end of the price war support price stabilization.
Nevertheless, elevated storage levels and the ballooning cost associated to do so may continue to depress oil prices and delay a recovery. And for those producers farthest away from refineries, reductions in storage levels are especially important to eliminate bottlenecks and reduce historically high basin differentials.


